Case Study: School Analytics
An interactive tool offering the ability for users to more deeply explore data directly within the dashboard to uncover insights into school rankings across countries, cities and regions.

Africa Tech Schools
Project Requirements
- Users want data-driven insights and reports from the same source of truth in an interactive dashboard.
- Users should be able to see key perfromance indicatiors such as tech ecosystem rank, # of schools by country, countries with 5+ coding bootcamps by region/country/city, etc.
- Client wants a serverless tool that automatically scales to tens of thousands of users, without any infrastructure to manage or capacity to plan for.
Project Overview
Africa < Tech /> Schools (ATS) is a catalog of technology colleges and universities, incubators, accelerators, innovation hubs, coding boot camps, and coworking spaces in Africa. Users can discover and learn about formal and informal technology spaces in the continent. They can search and view analytics and metrics to understand tech trends and perform comparative analysis of the tech ecosystem.
The Challenge
Create a dashboard that will give 100+ premium website users quick access to interactive analytics and reports showing technology ecosystem trends in Africa.
The Approach & Solution
80% of Africa Tech School users were located in the African continent, so we had to create a dashboard that could lender data quickly, whenever the dashboard was opened, or when users queried data. We wanted to pick a tool that was scalable, accessible, and cost-effective. After reviewing different business intelligence products, we chose Amazon QuickSight to build our dashboard. We chose Amazon QuickSight, because the website was tightly intergrated with the AWS ecosystem. In addition, the integration with the AWS data analytics stack, scalability, performance, and a competitive pricing model were key reasons for choosing Amazon QuickSight. We stored our data in Amazon RDS PostgreSQL database, we used AWS Glue to prepare, move, and integrate data from the database to Amazon QuickSight for user consumption.
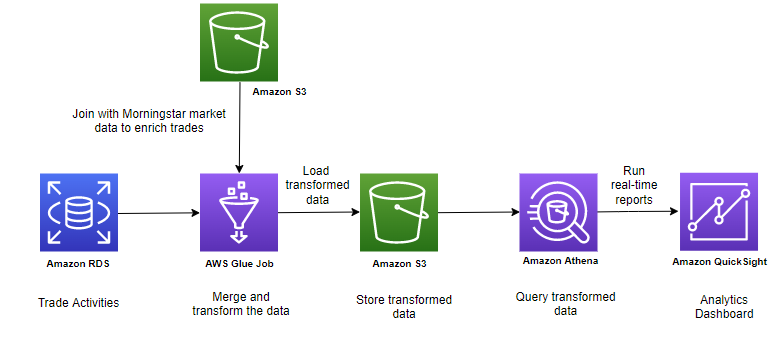 This is a representative of the data flow pipeline only, not actual data flow.
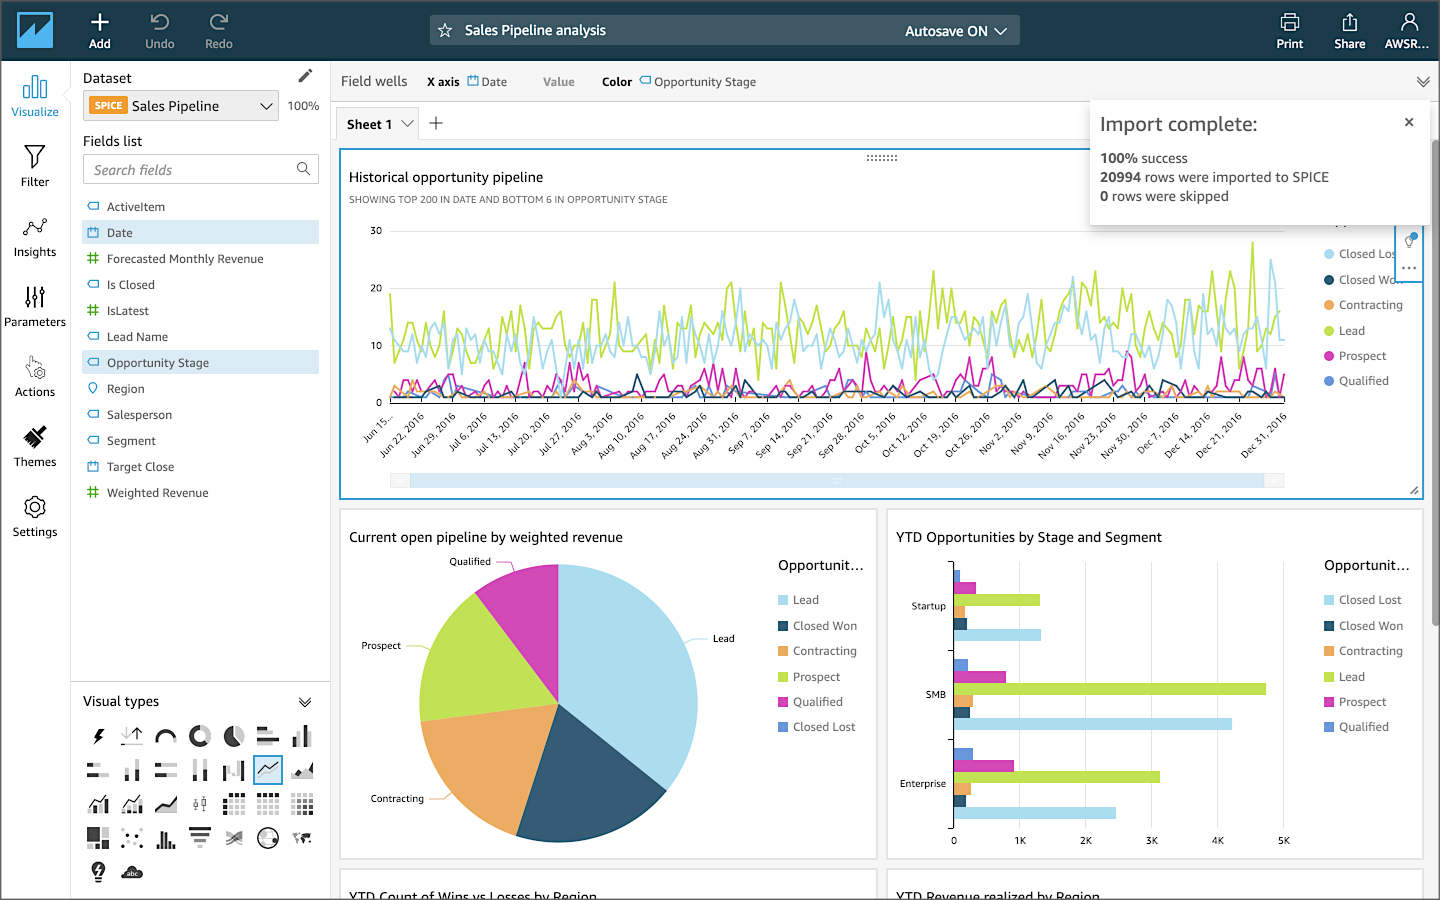 Due to client privacy we can't show the actual dashboard, this is a representative photo only, not actual dashboard.