Case Study: Work Performance Dashboard
"At-a-glance" view of how teams are doing when it comes to meeting performance goals for project delivered(the what), work time efficiency(the how) and client feedback(the results).

Digital Industry (Private Company)
Project Requirements
- Aggregate and analyze employee check-ins to monitor progress on client projects.
- Easily combine and analyze data from all people analytics systems and apps: HCM, payroll, compliance, recruiting, learning, LOB and more.
- Set up the work performance dashboard to be automatically shared with key stakeholders on a regular basis.
Project Overview
A work performance business intelligence tool that allows management to track, analyze, and report on work KPIs, like time spent on projects, attendance, feedback, and rank/ratings. The interactive dashboard should combine data from multiple data sources, to empower users to quickly explore and analyze data.
The Challenge
As we decided to use Qlik as the tool to build the dashboard. I was unfamiliar with its capabilities and the way it worked, I had to upskill within 1 month to deliver the dashboard to the client in 3 months.
The Approach & Solution
It took about 1 month to upskill in Qlik technology as it was a relatively new, and one-of-a-kind business intelligence platform at the time, around 2007-2008. I used online blogs and videos and I spent time after my classes in college to learn, to build the dashboard for the client. Once I was ready to build, I quickly pulled data from different data sources from the client's HR systems like timesheets, payments, and the CRM where they stored client project details. We built the data model using Qlik's scripting language, which was similar to PL/SQL or Advanced SQL.
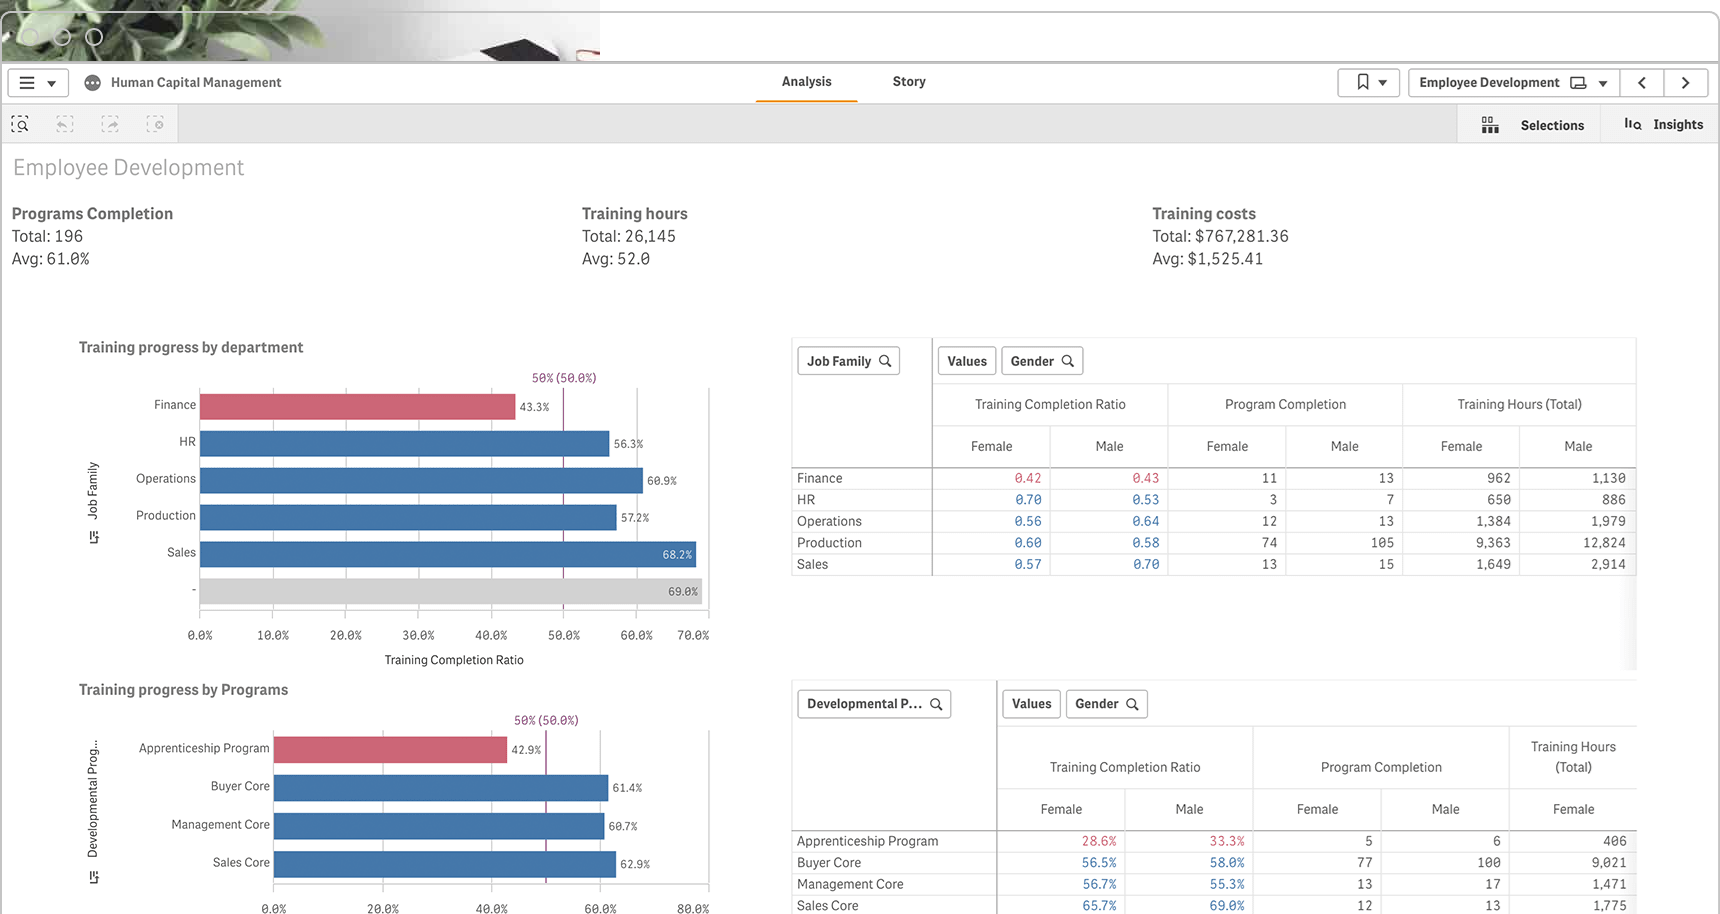 Due to client privacy we can't show the actual dashboard, this is a representative photo only, not actual dashboard.
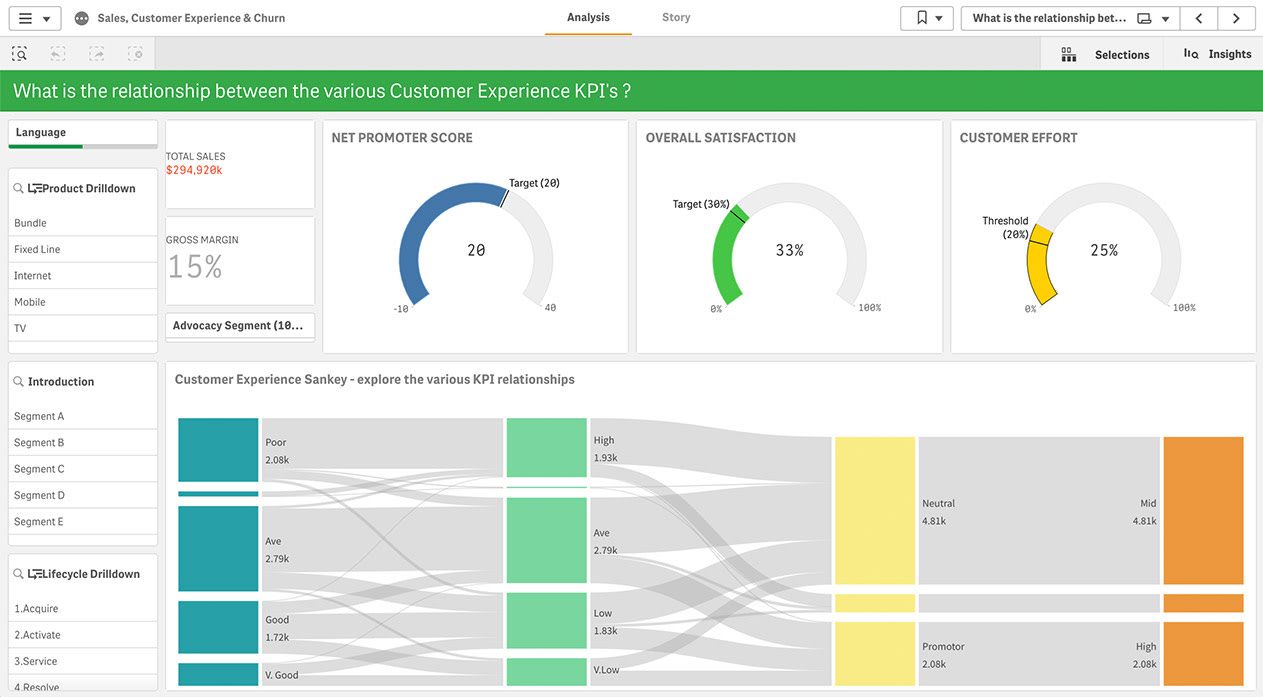 Due to client privacy we can't show the actual dashboard, this is a representative photo only, not actual dashboard.