Case Study: Real Estate Insights
A dashboard that gives the realtor an at-a-glance snapshot of the overall agency performance, to improve productivity, align key performance indicators, and maximize the motivation of the team.
Esenile (Private Company)
Project Requirements
- Create a view for management to show key performance indicators, like homes under contract, sold or available.
- Distribute a weekly report showing sales by city and county.
- Provide an online self-service pivot report where the team can analyse data across multiple data points and extract to excel.
Project Overview
The client wanted the dashboard to answer some of these key business questions: How do our real estate investments perform? Which cities generate the most revenue? What are the drivers of our investment performance? Which property types perform best on Net Rental Yield and Occupancy Rate? What is the rental performance of one specific property & how does it compare to similar properties? How do we perform in filling our properties over time?
The Challenge
80% of the data required to build the dashboard, existed on physical papers, or in local Excel documents. We had to migrate 50+ offline data files to a database.
The Approach & Solution
After analysing user requirements, we began searching for data sources to build the dashboard. The first issue we indentified was that, data was available in disparate physical paper documents, so we had to digitze documents manually from paper to excel format. The migration to excel took about a month, following that, we exported excel data into the PostgreSQL database. Once in the database, we started data modeling using SQL and tools like Tableau Prep to build tables required, for data visualization in the Real Estate Insight Dashboard. Lastly, we used Tableau to build charts and metrics based on the database tables we modeled, the dashboard was hosted in the Tableau server and cloud platform.
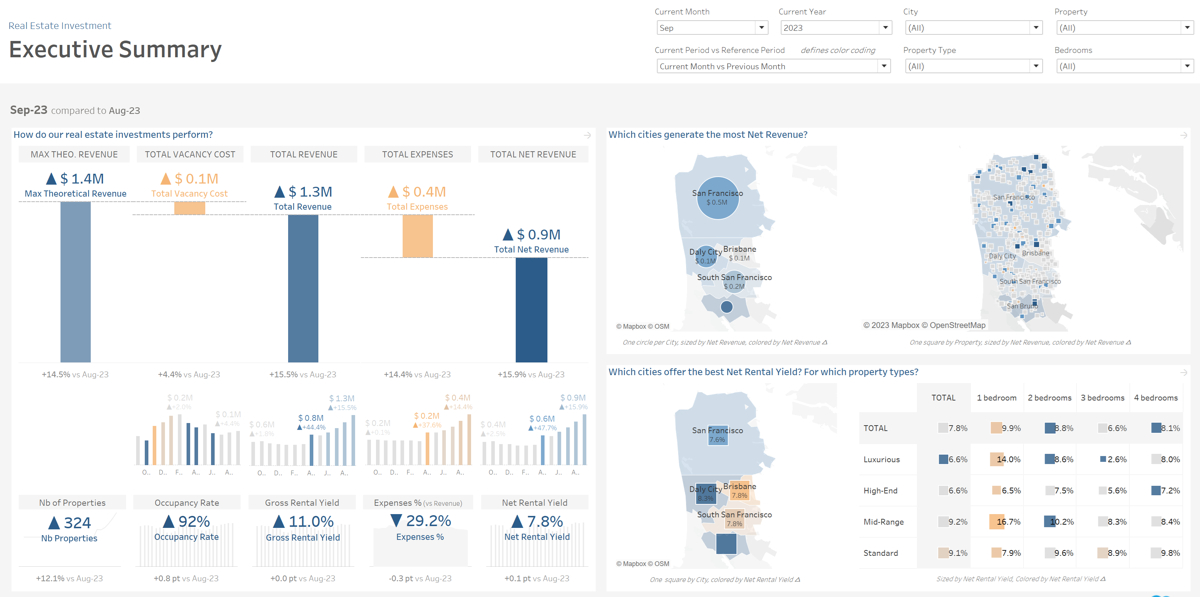 Due to client privacy we can't show the actual dashboard, this is a representative photo only, not actual dashboard.
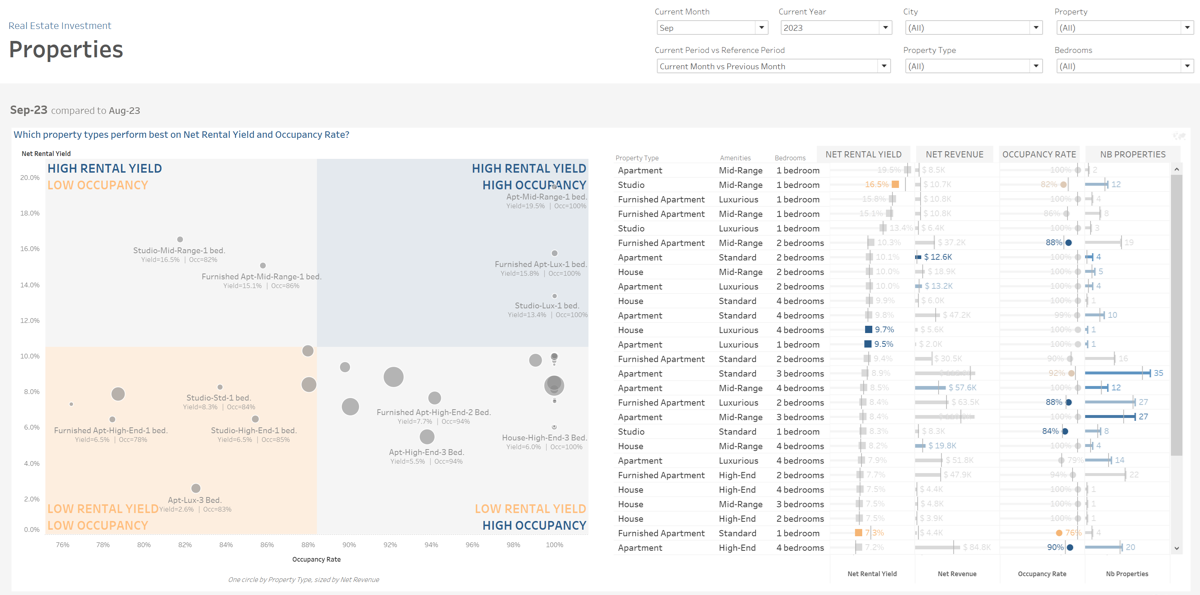 Due to client privacy we can't show the actual dashboard, this is a representative photo only, not actual dashboard.